Hi, I'm
Python Developer & Data Analyst
I transform complex data into actionable insights and build robust web applications. Based in the beautiful mountains of Himachal Pradesh, I combine technical expertise with creative problem-solving.
I transform complex data into actionable insights and build robust web applications. Based in the beautiful mountains of Himachal Pradesh, I combine technical expertise with creative problem-solving.
I'm a passionate Python developer with expertise in data analysis, visualization, and web development. With a strong foundation in Python and its powerful libraries, I create solutions that turn complex data into meaningful insights.
My journey in programming started during my college years and has evolved into a deep expertise in Python development. I enjoy solving complex problems and building applications that make a difference.
I specialize in creating data-driven applications using Python, Flask, and Streamlit, and transforming raw data into compelling visual stories with Power BI and Matplotlib.
When I'm not coding, you'll find me exploring the beautiful mountains of Himachal Pradesh, reading tech blogs, or contributing to open-source projects.
My expertise in various technologies and tools, presented with visual logos for each skill
Explore my recent work and data science projects
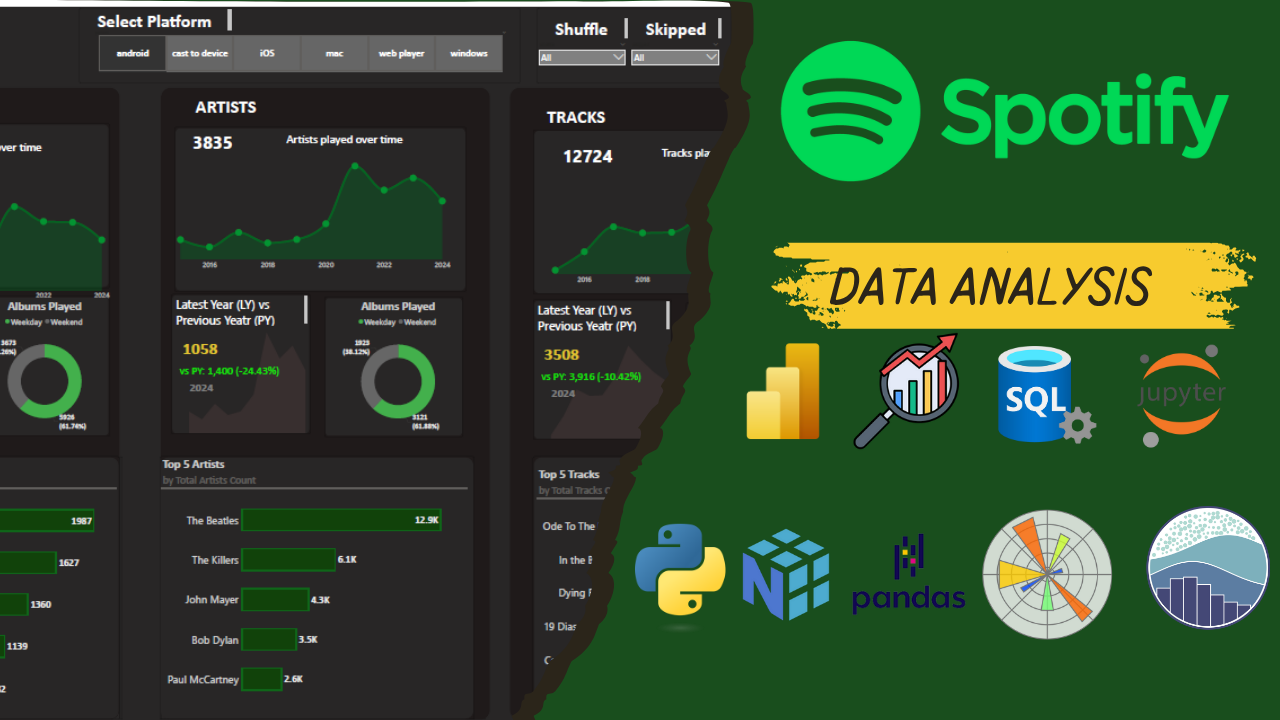
An interactive Power BI dashboard analyzing Spotify listening behavior. Data was extracted using Python and MySQL, cleaned with Pandas and NumPy, and visualized using Power BI with Matplotlib and Seaborn for EDA.
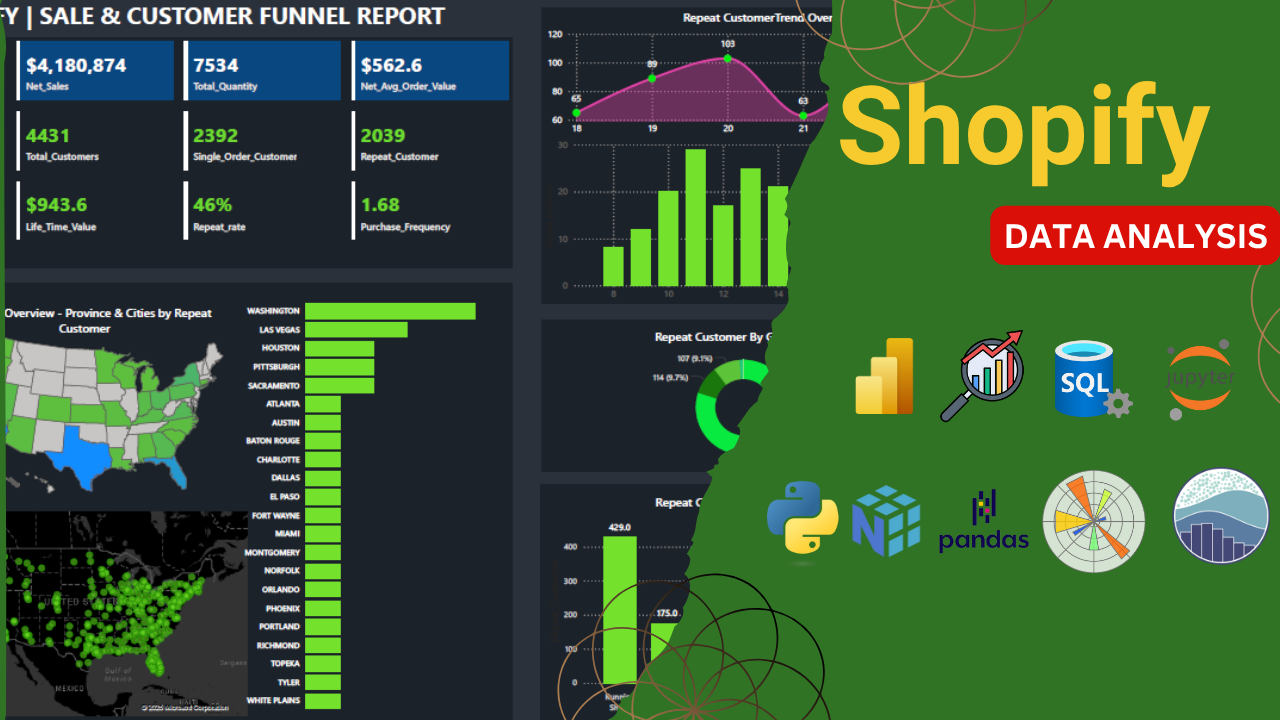
An interactive dashboard for analyzing and visualizing Shopify sales data. Built using Python, Power BI, and MySQL to track KPIs like total sales, order volume, and product performance.
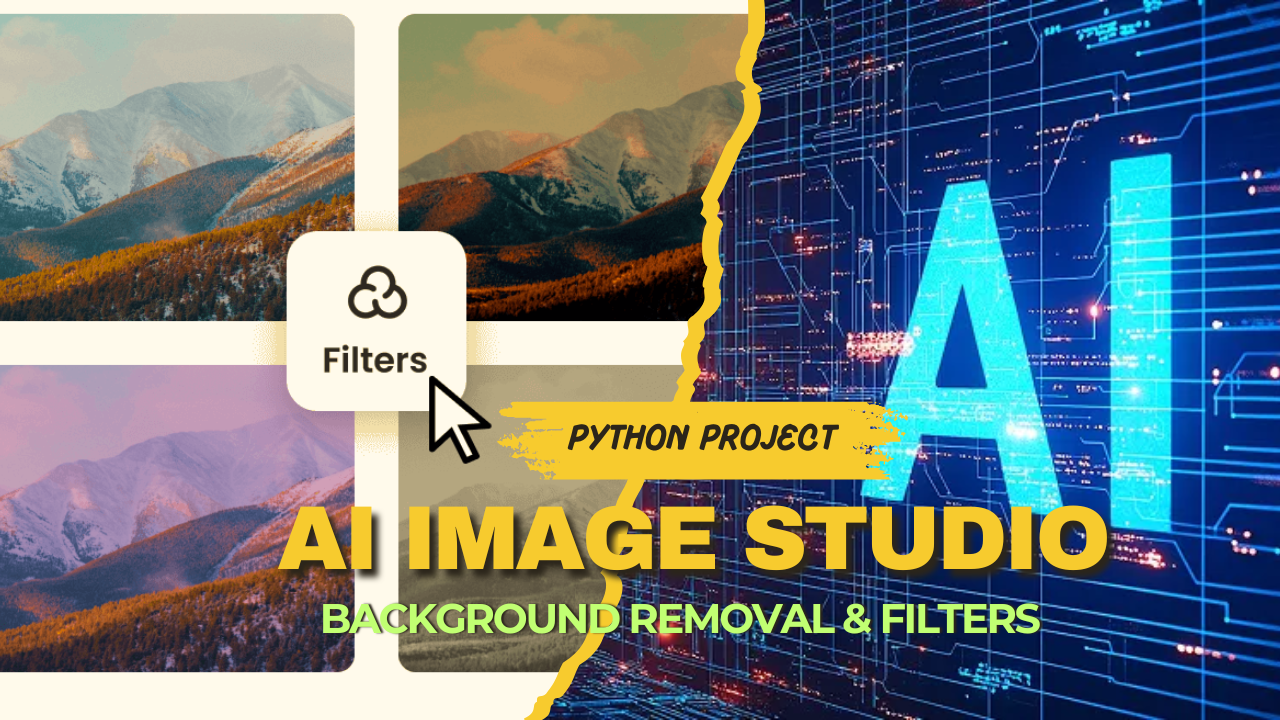
Upload any image to instantly remove its background with our AI-powered technology. Perfect for product photos, portraits, and more!
Feel free to reach out for collaborations or just a friendly hello
Himachal Pradesh, India
itsvikasharma007@gmail.com
+91 XXXXXXXX15